In the dynamic world of trading, understanding and interpreting your trading performance is crucial for making informed decisions and refining your strategy. In this comprehensive guide, we'll walk you through the key metrics available on the Trading Performance page of your accounts, offering valuable insights into your trading activities.
As of now, trading performance data for Spot, Perpetual, Futures and Options contracts is available.
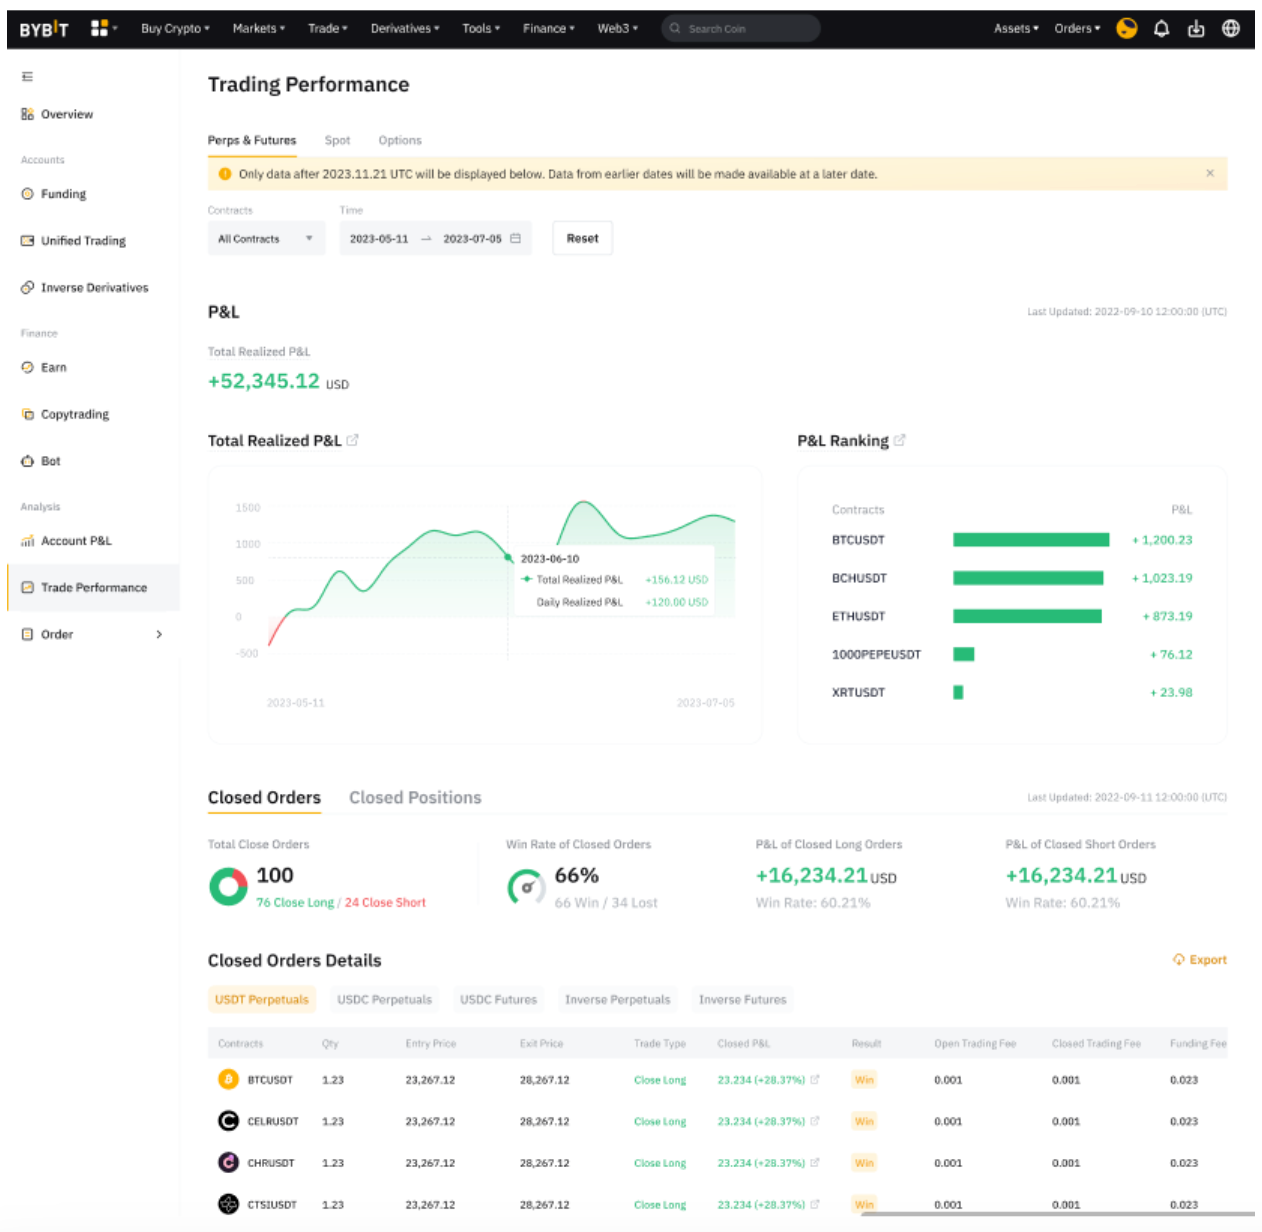
Navigating the Trading Performance Page
Perpetual & Futures
Note: Please be aware that only the data after Nov 21, 2023, 12AM (midnight) UTC will be displayed below on the page. Data from earlier dates will be made available at a later date.
P&L
|
Term |
Definition |
Frequency of Update |
|---|---|---|
|
Total P&L |
The sum of all realized P&L during the chosen timeframe, inclusive of opening/closing fees and funding fees. |
12AM (midnight) UTC Daily |
|
P&L Chart |
Graphic representation indicating the overall trend of total P&L over the selected time period. |
12AM (midnight) UTC Daily |
|
P&L Ranking |
Ranking of realized P&L within the selected time period, sorted by absolute value from highest to lowest. |
12AM (midnight) UTC Daily |
Closed Orders
|
Term |
Definition |
Frequency of Update |
|
Total Closed Orders |
All closed orders within the selected time period. |
Real Time |
|
Win Rate of Closed Orders |
Percentage of closed orders resulting in profit within the selected time period. |
Real Time |
|
P&L of Closed Long Orders |
Profits and losses of closed long positions within the selected time period. |
Real Time |
|
P&L of Closed Short Orders |
Profits and losses of closed short positions within the selected time period. |
Real Time |
|
Details of Closed Orders |
This shows the Closed P&L of all closed orders. Closed P&L = Position P&L - Opening Fee - Closing Fee - Funding Fee |
Real Time |
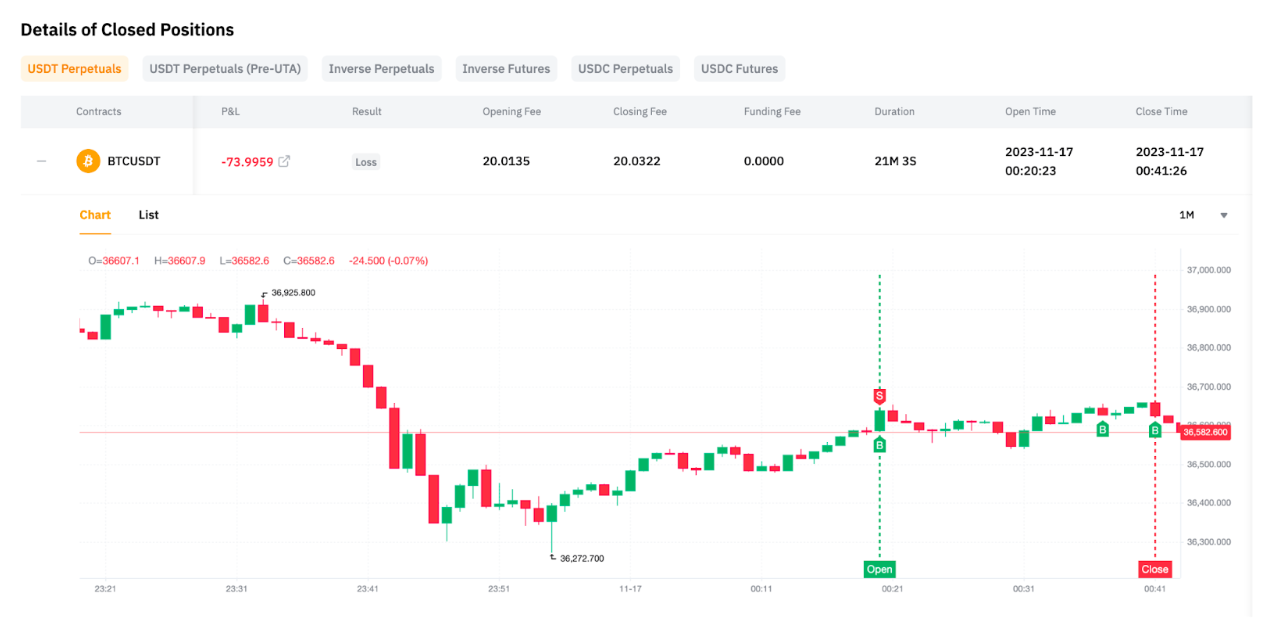
Closed Positions
In this tab, you can review a comprehensive log of your closed Long and Short positions. It includes details from the initial opening order to the final closing order, allowing traders who perform multiple partial closings over an extended period to evaluate their trading history, assess earnings, and gauge the success of their strategy.
|
Term |
Definition |
Frequency of Update |
|
Total Positions |
Total number of fully closed positions within the selected time period. |
Real Time |
|
Win Rate |
Percentage of closed positions resulting in profit within the selected time period. |
Real Time |
|
Avg. Trade Duration |
The average duration of trades, providing insights into the holding period. |
Real Time |
|
P&L Ranking |
Ranking of P&L generated from closed positions, sorted by absolute value. |
Real Time |
In the Details of Closed Positions tab, you can expand each closed position to view the Chart that shows your entry and exit price points. Additionally, you can also select the time interval of the chart on the upper right corner and adjust the chart size.
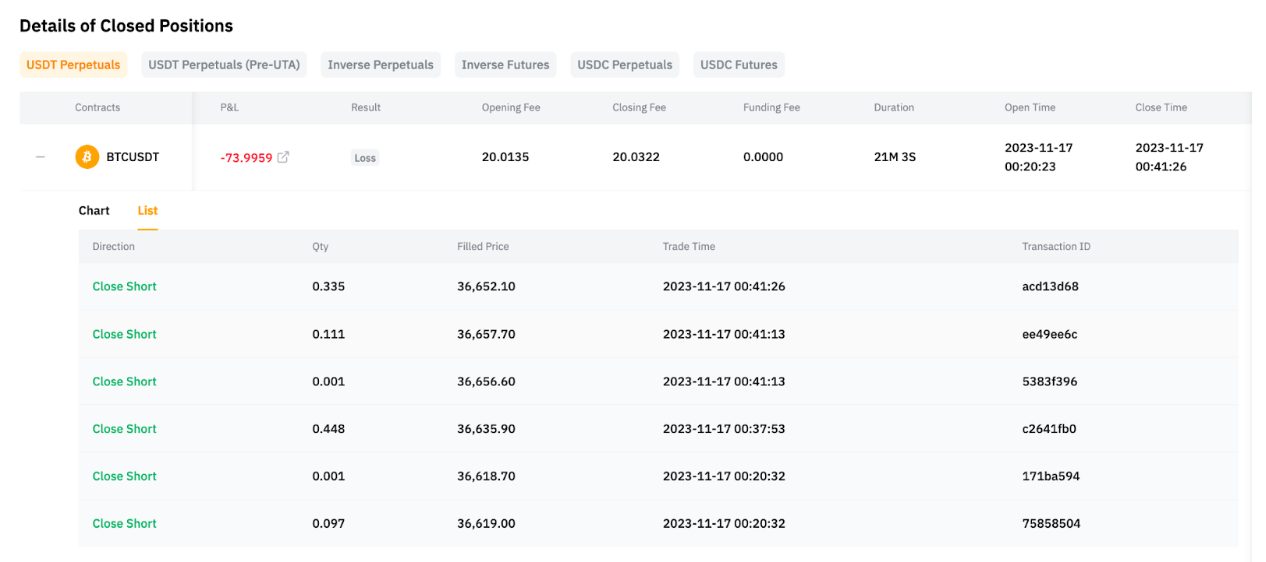
In the List tab, you can access all trades associated with the position. This tab exclusively displays fully closed positions. For order details related to partially closed positions, you can refer to Details of Closed Orders under Trading Performance.
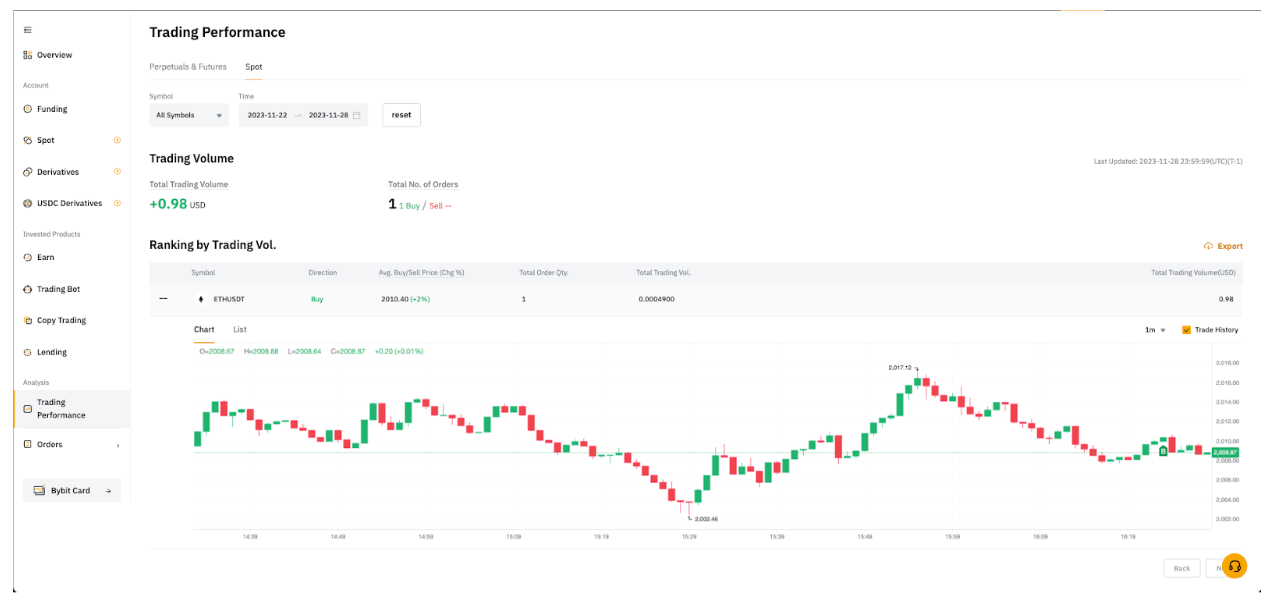
Spot
Note: Please be aware that only the data after Nov 21, 2023, 12AM (midnight) UTC will be displayed below on the page. Data from earlier dates will be made available at a later date.
Trading Volume
|
Term |
Definition |
Frequency of Update |
|
Total Trading Volume |
The sum of buy and sell trading values for all Spot trading pairs within the timeframe. |
12AM (midnight) UTC Daily |
|
Total No. of Orders |
The count of Spot orders placed within the timeframe. |
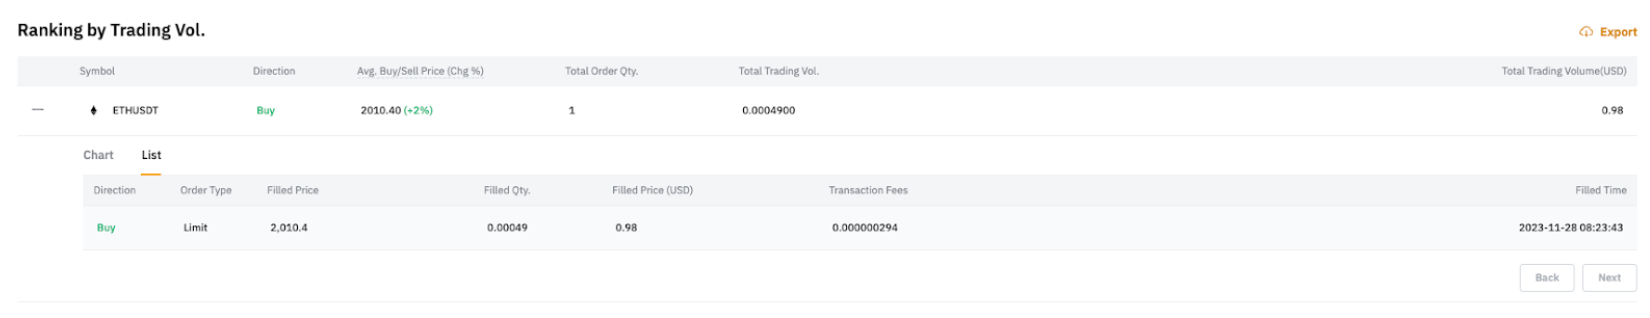
Ranking by Trading Volume
|
Term |
Definition |
Frequency of Update |
|
Realized P&L |
Realized P&L = Quantity Sold * (Average Selling Price - Average Buying Price) *If the quantity sold exceeds the quantity bought, the excess sold quantity will not be factored into the calculation. |
12AM (midnight) UTC Daily |
|
Unrealized P&L |
Unrealized P&L = (Quantity Bought - Quantity Sold) * (Last Traded Price - Average Buying Price) *If the quantity sold exceeds the quantity bought, the excess sold quantity will not be factored into the calculation. | |
|
Avg. Buy/ Sell Price (Change%) |
The average buy or sell price of the corresponding Spot trading pair for the selected period.
| |
|
Total Order Qty |
The cumulative count of orders placed for the corresponding Spot trading pair during the selected period. | |
|
Total Trading Volume |
The total trading volume for the corresponding Spot trading pair during the selected period. |
In the Ranking by Trading Vol tab, you can expand each symbol to view the Chart that shows your buy and sell points within the selected timeframe. Additionally, you can also select the time interval of the chart in the upper right corner and adjust the chart size.
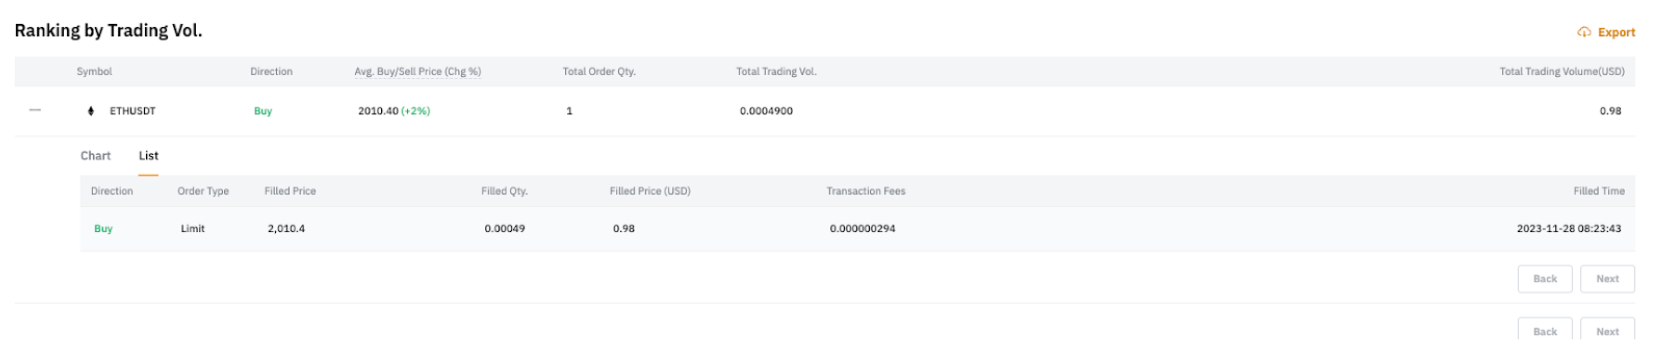
In the List tab, you can access all trades associated with the symbol within the selected timeframe.
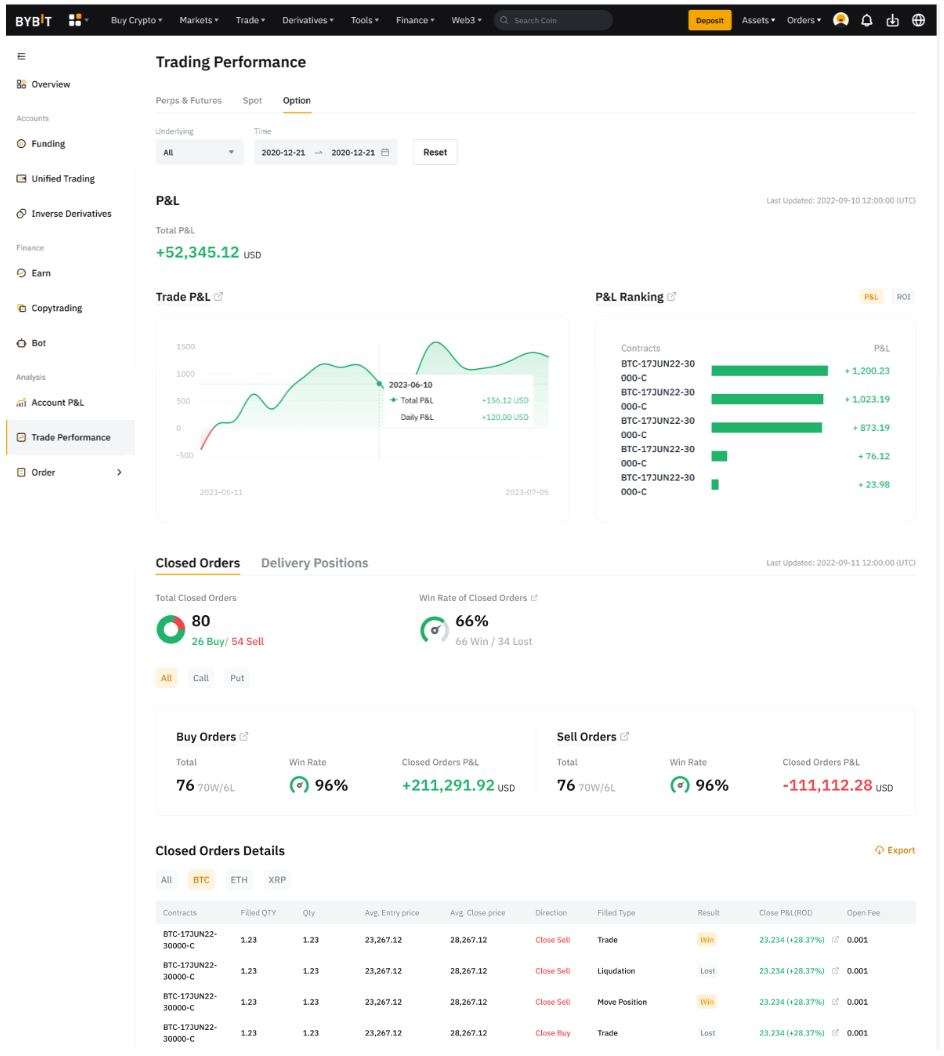
Options
Currently, the trading performance data for Options is only accessible to Unified Trading Account users, whose accounts are viewable in Isolated Margin, Cross Margin, and Portfolio Margin modes.
Note: Please be aware that only the data after Jan 18, 2024, 12AM (midnight) UTC will be displayed below on the page. Data from earlier dates will be made available at a later date.
P&L
|
Term |
Definition |
Frequency of Update |
|---|---|---|
|
Total P&L |
Total P&L = ∑ (Closed P&L + Delivery P&L) |
12AM (midnight) UTC Daily |
|
P&L Chart |
Graphic representation indicating the overall trend of total P&L and daily P&L* over the selected period. * Daily P&L = ∑ (Daily Closed Order P&L + Daily Delivery P&L) |
12AM (midnight) UTC Daily |
|
P&L Ranking |
Ranking of realized P&L within the selected period, sorted by absolute value from highest to lowest. |
12AM (midnight) UTC Daily |
Closed Orders
|
Term |
Definition |
Frequency of Update |
|
Total Closed Orders |
All closed orders within the selected period. |
Real Time |
|
Win Rate of Closed Orders |
Percentage of closed orders resulting in profit within the selected period. |
Real Time |
|
Total |
Total quantity of closed buy or sell orders. |
Real Time |
|
Win Rate |
The Win Rate is calculated as the percentage of winning orders (win order number) out of the total number of orders during the selected period. |
Real Time |
|
Closed Orders P&L |
This shows the Closed P&L of all closed buy or sell orders. |
Real Time |
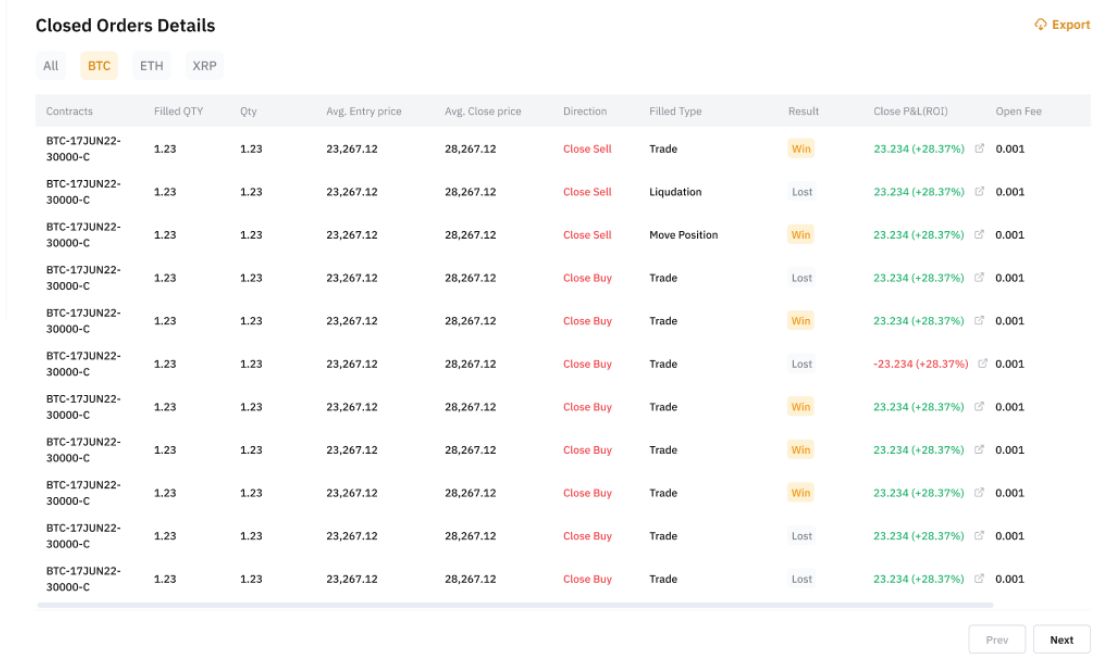
Details of Closed Orders
In the Details of Closed Orders tab, you can select All to view all closed orders. Alternatively, you can access comprehensive order information for specific contracts, including contract name, filled quantity, average entry price, average close price, filled type, and more.
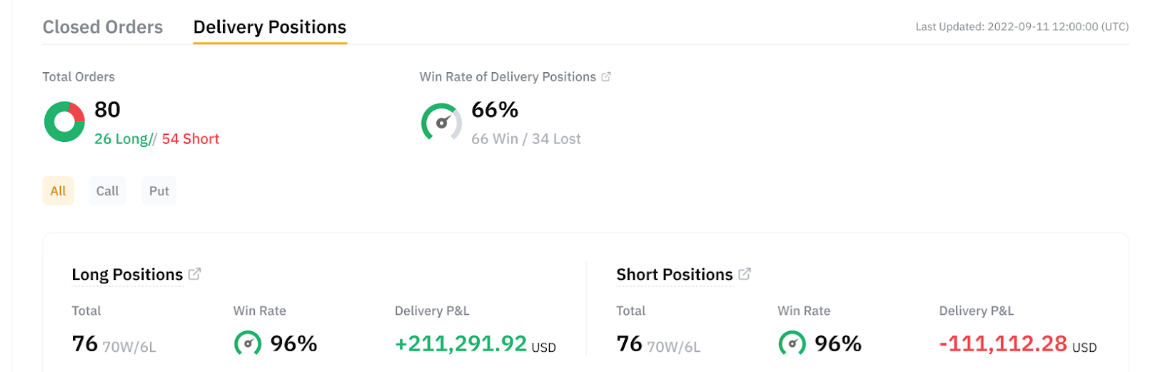
Delivery Positions
|
Term |
Definition |
Frequency of Update |
|
Total Delivery Positions |
All delivery positions within the selected period. |
Real Time |
|
Win Rate of Delivery Positions |
Percentage of delivery positions resulting in profit within the selected period. |
Real Time |
|
Total |
Total quantity of delivery long or short positions. |
Real Time |
|
Win Rate |
The Win Rate is calculated as the percentage of winning positions (win positions quantity) out of the total quantity of positions during the selected period. |
Real Time |
|
Delivery P&L |
This shows the delivery P&L of all delivery long or short positions. |
Real Time |
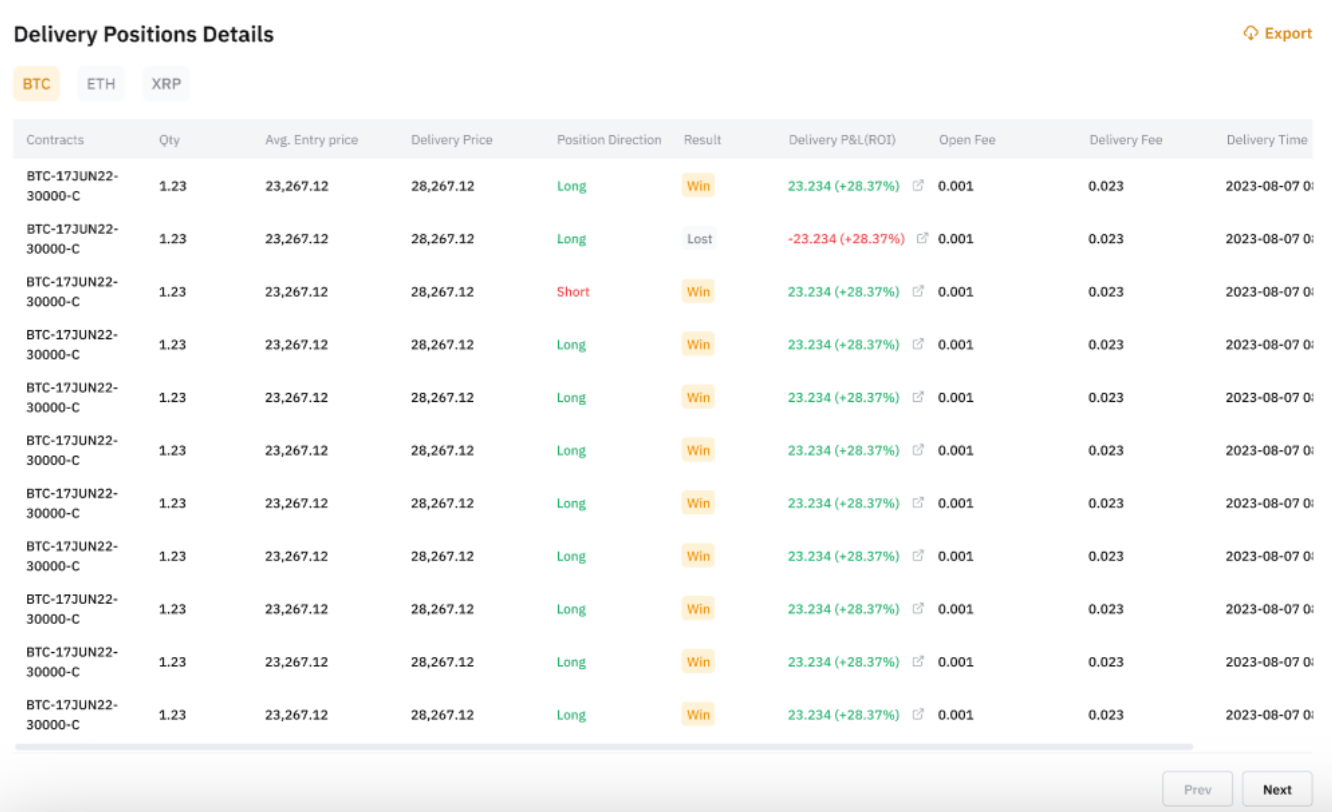
Details of Delivery Positions
In the Details of Delivery Positions tab, you can select All to view all delivery positions. Alternatively, you can access comprehensive position details for specific contracts, including contract name, quantity, average entry price, delivery price, realized price, and more.